Basic troubleshooting on Azion Web Platform
Use this guide to troubleshoot your application on the Azion Web Platform. Learn how to enable Debug Rules, use Real-Time Events, and query data with GraphQL to understand why specific actions were applied to your requests. This guide includes a practical example that shows how to identify which rules were executed and why a request was blocked.
Enabling Debug Rules
Debug Rules can be enabled in both Applications and Firewall. They show which rules were executed for a request and the actions those rules took (blocking is just one example), helping you understand why a specific action was applied.
To enable Debug Rules for Applications:
- Access Console.
- Go to Products menu > Applications.
- Select an existing application to activate debug.
- On the Main Settings tab, enable the Debug Rules option.
- Click the Save button.
To enable Debug Rules for Firewalls:
- Access Console.
- Go to Products menu > Firewalls.
- Select the firewall you want to configure.
- On the Main Settings tab, enable the Debug Rules option.
- Click the Save button.
Real-Time Events
To access Real-Time Events, follow these steps:
- Access Console.
- On the upper-left corner, select Products menu > Real-Time Events.
- Select the HTTP Requests tab.
- Modify the desired time range and filters.
- Click the Search button.
GraphQL
To access the Azion GraphQL built-in playground accessible via the Real-Time Events menu, or by visiting this link.
By default, all requests are logged using the UTC time zone.
A practical example
For this example we will use a sample application in which when you access the /block URI the request will be blocked with a 403 status.
So if you tried to access the site you will get a 403 error page that looks like this:
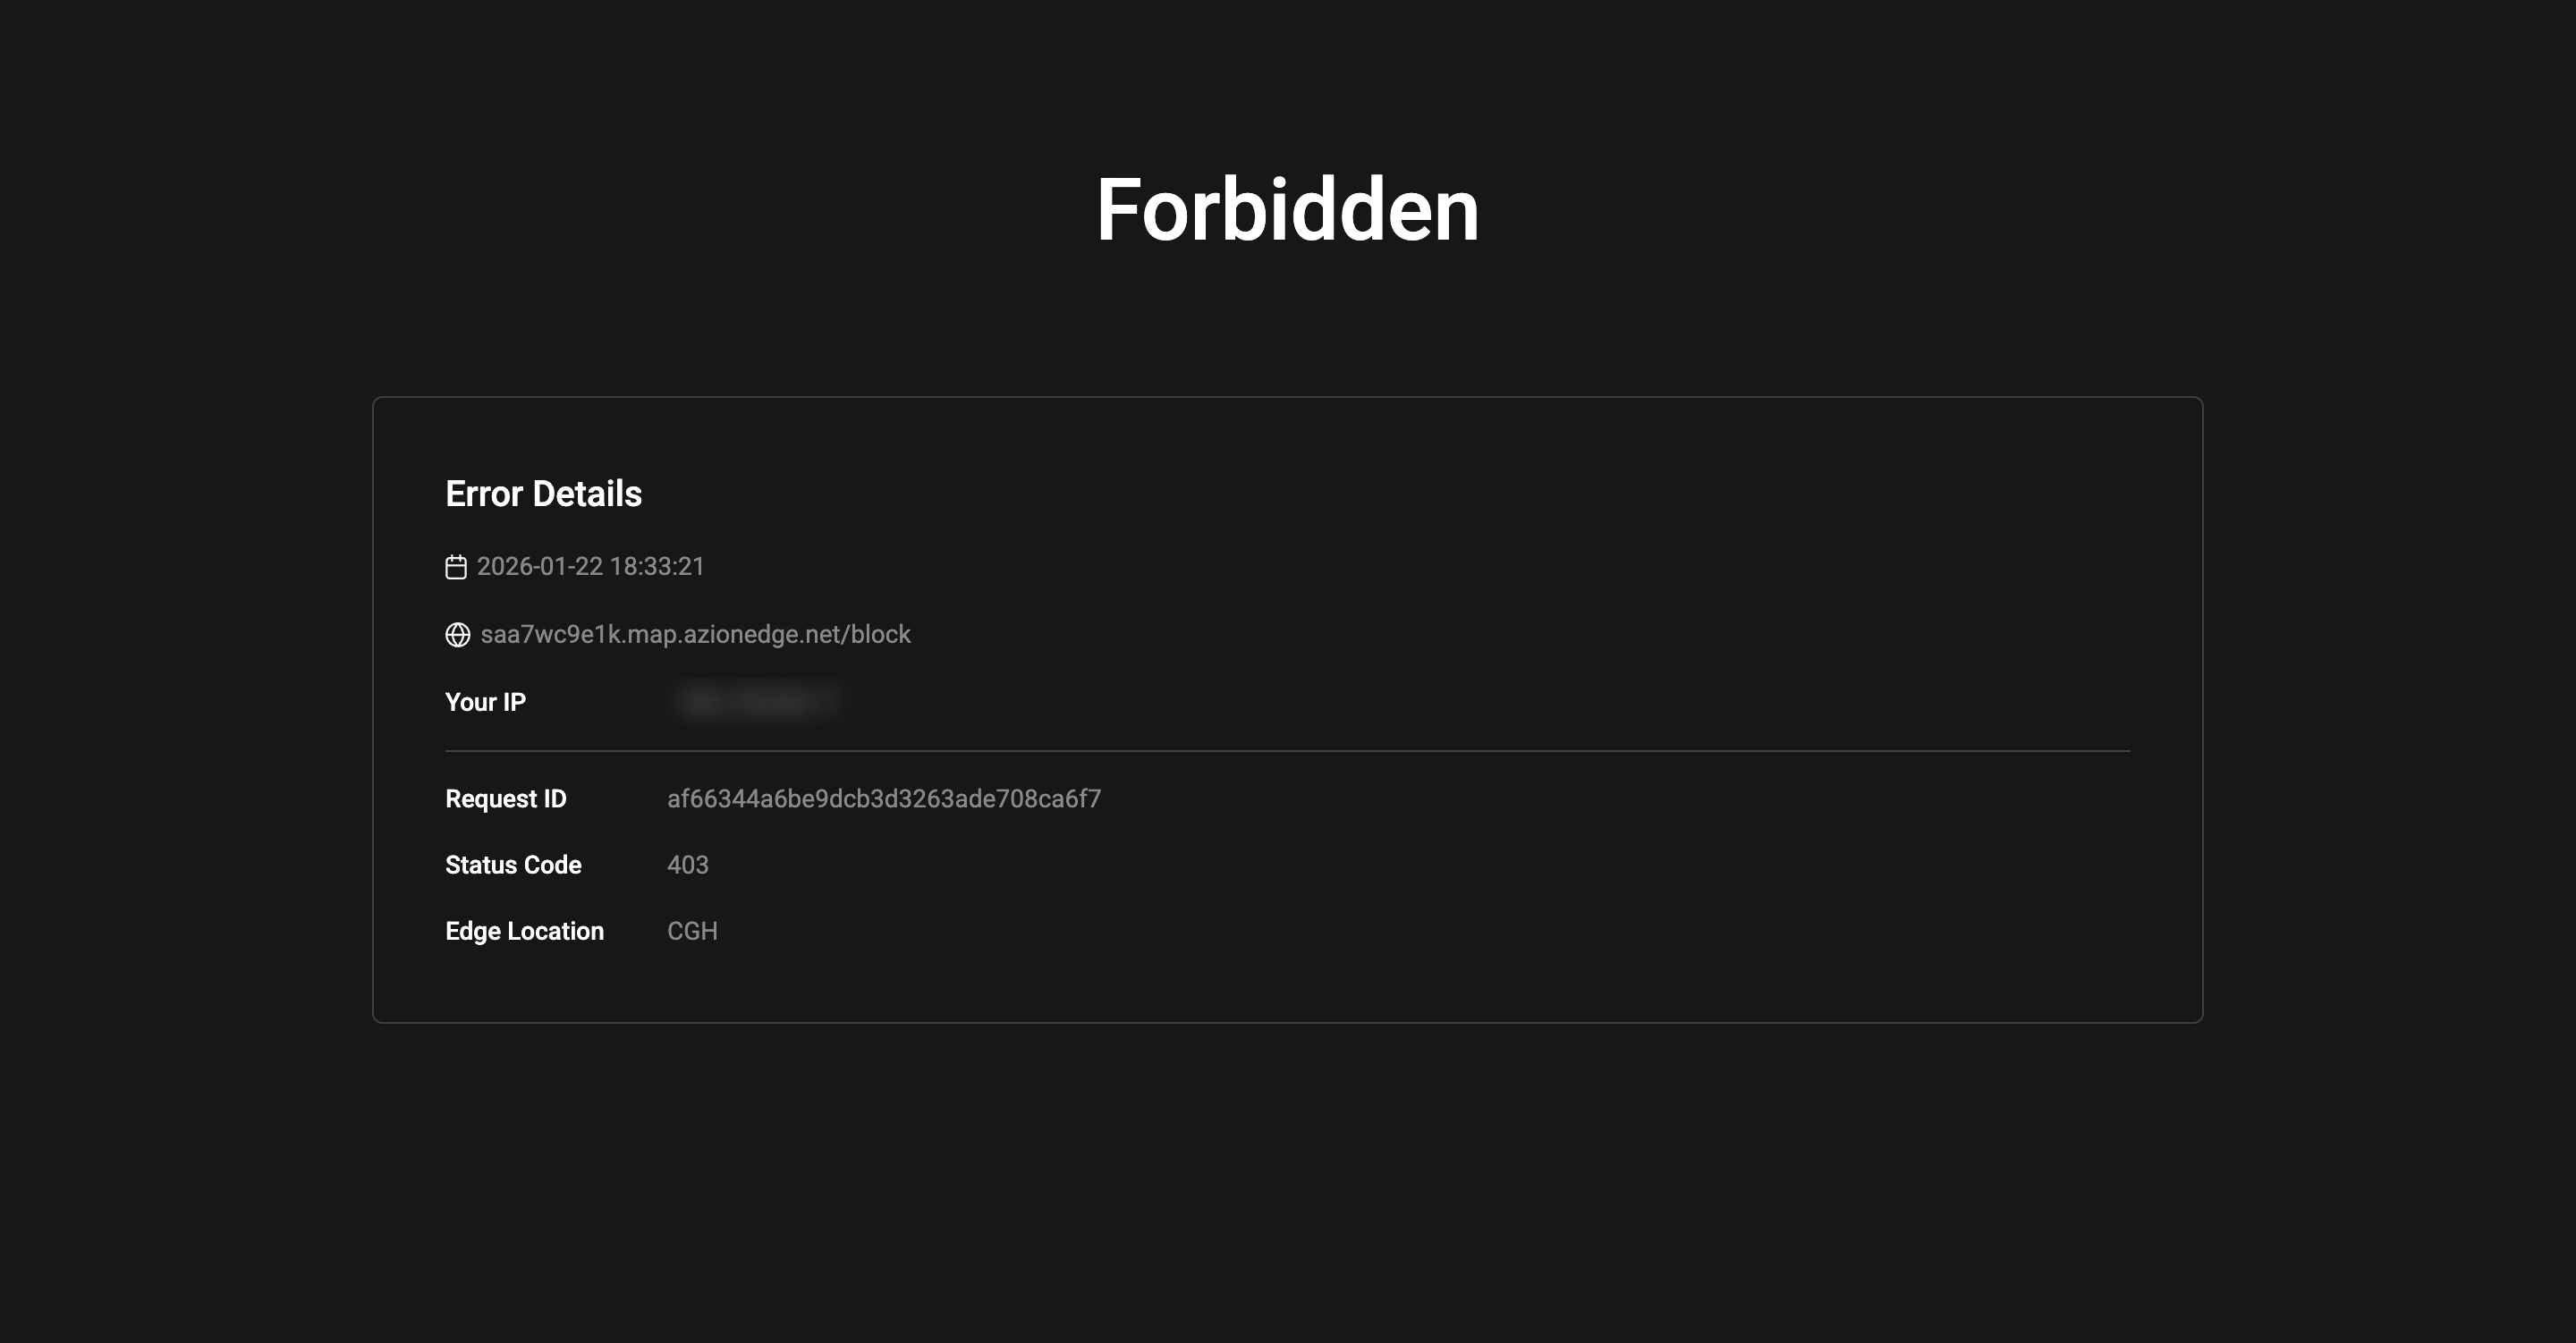
How can you find out exactly why this request was blocked?
For the steps below, copy the Request ID displayed on the page.
In Real Time Events
- Access Real-Time Events
- Filter by the request id you copied.
- Select the log body.
- Look for the stacktrace field.
You’ll see a response similar to this:
{ "edge_application_request": [ "Default Rule", "block" ]}The stacktrace field tells you that the Application rule named block was executed.
In GraphQL Playground
- Access the GraphQL Playground
- Run the query below, replacing the
tsRangeandrequestIdEqfields with the correct values.
 query (  $tsRange_begin: DateTime!  $tsRange_end: DateTime!) {  httpEvents (    limit: 10    orderBy: [ts_DESC]    filter: {      tsRange: { begin: $tsRange_begin, end: $tsRange_end }      #hostEq:      #statusEq:      #requestIdEq:""    }  ) {        ts        requestId    #configurationId    host    #requestMethod    status        upstreamStatus        #upstreamResponseTime    #upstreamBytesSent    #sslProtocol    #wafLearning    #requestTime    #serverProtocol    upstreamCacheStatus    #httpReferer    remoteAddress        stacktrace    wafMatch    #serverPort    #sslCipher    wafEvheaders    #serverAddr    #scheme    httpUserAgent
  }}
You’ll get a response similar to this:
{ "data": { "httpEvents": [ { "configurationId": "xxx", "host": "xxxxx.azionedge.net", "requestId": "your_request_id_here", "httpUserAgent": "Mozilla/5.0 (Macintosh; Intel Mac OS X 10_15_7) AppleWebKit/605.1.15 (KHTML, like Gecko) Version/26.1 Safari/605.1.15", "requestMethod": "GET", "status": 403, "ts": "2026-01-22T21:10:38Z", "stacktrace": "{\\\"edge_application_request\\\":[\\\"Default Rule\\\",\\\"block\\\"]}", "upstreamBytesSent": 0, "sslProtocol": "TLSv1.3", "wafLearning": "-", "requestTime": "0", "serverProtocol": "HTTP/2.0", "upstreamCacheStatus": "-", "httpReferer": "-", "remoteAddress": "xxxx", "wafMatch": "-", "serverPort": "443", "sslCipher": "TLS_AES_256_GCM_SHA384", "wafEvheaders": "-", "serverAddr": "179.191.174.11", "scheme": "https" } ] }}The stacktrace field tells you that the Application rule named block was executed.