Historical Real-Time Metrics
Real-Time Metrics has two versions: Historical and New. If you want to access data of up to 2 years before the date of October 15th, 2022, contact the Support team and request access to Historical Real-Time Metrics. This version will remain available until the end of 2024, when it’ll be discontinued.
You can already use the New Real-Time Metrics and will be able to continue using it.
Historical Real-Time Metrics is an Observe product that provides you with real-time access to metrics, through graphs, so you can analyze the events of your applications and products configured on Azion. It also helps you optimize the use of Azion products and how your content is delivered.
By analyzing data through Real-Time Metrics, you can check and track the behavior of your applications in near real time. Real-Time Metrics gives you the opportunity to:
- Gain insights on the performance of your application.
- Examine the availability of your content.
- Quantify accesses and traffic to your content.
- See bandwidth savings.
- Find security threats in real time.
- Troubleshoot problems in real time.
- Compare your application’s data through different data intervals.
You can combine your metrics analysis with Real-Time Events to further inspect your logs.
Access
To access Real-Time Metrics, contact the Support team and request access to Historical Real-Time Metrics. You’ll receive the access link to the data source you want to analyze.
Data consideration
When comparing the data displayed on Real-Time Metrics and Azion Billing data, you may find differences. Real-Time Metrics focuses on performance, using an at-most-once approach, while Billing seeks precision, using an exactly-once approach. If you find such differences, you should consider Azion Billing data as the correct one.
On average, the difference between the two is smaller than 1%. See Azion Pricing and the Billing documentation for more information.
Tabs navigation
After selecting one of the product’s tabs, you’ll see the available graphs for that specific product according to the data on your account. If you select Data Stream, for example, you’ll see graphs related to the streams configured in your account.
The products also have subtabs, which separate different types of metrics for the same product, and some have several subtabs. The tabs and subtabs are divided as:
-
Data Stream
- Data Streamed
- Data Stream Requests
-
Edge Applications
- Data Transferred
- Requests
- Status Codes
- HTTP Methods
- WAF
- Bandwidth Saving
-
Edge Functions
- Invocations
-
Edge DNS
- Standard Queries
-
Image Processor
- Requests
Filters
After you select the product you’ll be analyzing, you need to configure the filters to fetch data for your graphs.
On Real-Time Metrics’ screen, just before the section with the charts, you find the filters according to the product you’ve chosen. Find out more about the configurations for each product tab next.
Data Stream
-
Time Range: dropdown menu to select the period you want to use to exhibit data on your graphs. You can choose between:
- Last Hour
- Last 3 Hours
- Last 6 Hours
- Last 24 Hours
- Last 3 Days
- Last 7 Days
- Last 15 Days
- Last 30 Days
- Custom
If you select Custom for a time range, you need to manually set up the beginning and ending dates in the two calendar fields.
After you configure the Time range, you can select the Filter button to apply your configurations. Your filter configurations apply to all subtabs of the data source even as you change subtabs.
Edge Applications
-
Configurations: dropdown menu to select the edge applications you want to use to exhibit data on your graphs.
-
Time Range: dropdown menu to select the period you want to use to exhibit data on your graphs. You can choose between:
- Last Hour
- Last 3 Hours
- Last 6 Hours
- Last 24 Hours
- Last 3 Days
- Last 7 Days
- Last 15 Days
- Last 30 Days
- Custom
If you select Custom for a time range, you need to manually set up the beginning and ending dates in the two calendar fields.
After you configure the Time range, you can select the Filter button to apply your configurations. Your filter configurations apply to all subtabs of the data source, even as you change subtabs.
Edge Functions
-
Edge Functions: dropdown menu to select the edge function or functions you want to use to exhibit data on your graphs.
-
Time Range: dropdown menu to select the period you want to use to exhibit data on your graphs. You can choose between:
- Last Hour
- Last 3 Hours
- Last 6 Hours
- Last 24 Hours
- Last 3 Days
- Last 7 Days
- Last 15 Days
- Last 30 Days
- Custom
If you select Custom for a time range, you need to manually set up the beginning and ending dates in the two calendar fields.
After you configure the Time range, you can select the Filter button to apply your configurations.
Edge DNS
-
Zones: dropdown menu to select the zone or zones from your Edge DNS you want to use to exhibit data on your graphs.
-
Time Range: dropdown menu to select the period you want to use to exhibit data on your graphs. You can choose between:
- Last Hour
- Last 3 Hours
- Last 6 Hours
- Last 24 Hours
- Last 3 Days
- Last 7 Days
- Last 15 Days
- Last 30 Days
- Custom
If you select Custom for a time range, you need to manually set up the beginning and ending dates in the two calendar fields.
After you configure the Time range, you can select the Filter button to apply your configurations.
Image Processor
-
Time Range: dropdown menu to select the time period you want to use to exhibit data on your graphs. You can choose between:
- Last Hour
- Last 3 Hours
- Last 6 Hours
- Last 24 Hours
- Last 3 Days
- Last 7 Days
- Last 15 Days
- Last 30 Days
- Custom
If you select Custom for a time range, you need to manually set up the beginning and ending dates in the two calendar fields.
After you configure the Time range, you can select the Filter button to apply your configurations.
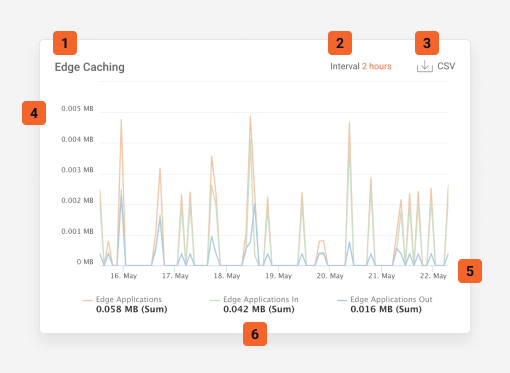
Graph’s information
In the second section of Real-Time Metrics, right after the filters, you find all the available graphs for your account.
After you select a data source and, possibly, subtab, you can analyze your data for each graph.
Each graph has the following properties:
-
- Title: descriptive name for the graph.
-
- Interval: automatic data time interval to fetch your data. Data can be fetched in intervals of: minutes, hours, or days.
-
- CSV: button to download and export the points presented on the graph according to the data displayed, the time range applied, and the presented interval.
-
- Graph series: representation of data categories.
- Example: in a line graph that shows the number of requests over time, you can have several series, each one representing a different domain. Each series will have data points connected by a line to exhibit how the number of requests varied over time for each domain.
-
- Time interval line: the x-axis of the graph, representing the time period line for the data on the graph.
-
- Legend: reflects and describes data and series from the y-axis. You can select and deselect each legend item to change the data displayed on the graph.
Metrics’ monitoring
To monitor your metrics, you find a set of several graphs with specific data, divided according to data sources. They’re divided into tabs:
Data Stream - Edge Applications - Edge Functions - Edge DNS - Image Processor
You can find detailed information about each tab and subtabs and about each of the graphs available on the New Real-Time Metrics documentation.
Navigation between tabs may be different between the Historical and the New versions, but you can try searching for the title of the graph to find the description.
Limits
When configuring filters, on the fields:
- Configurations (Edge Applications)
- Edge Functions (Edge Functions)
- Zones (Edge DNS)
You can choose up to 4 items at a time.