
Azion's Product Launch Week - May 2025
Azion announces a series of product launches and enhancements to its web platform.
MAY 7, 2025 • 10 min read
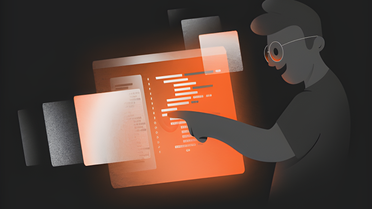
Visual Language Models (VLMs) Domain Adaptation with LoRa for Real-Time Fraud Detection
Learn how Edge AI, along with domain adaptation techniques like LoRa, can be leveraged to deploy AI models optimized for specific fraud scenarios, ensuring real-time detection and prevention capabilities.
MAY 29, 2025 • 10 min read

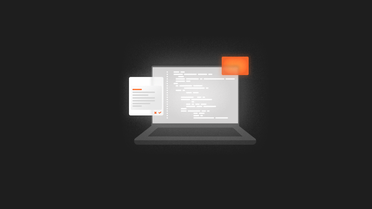
Improving Developer Experiences: What’s New in Azion Dev Tools and Platform
Azion just launched new developer experience enhancements: cross-platform CLI, faster Bundler 5.1, Git templates with CI/CD, azion.app domain for applications, expanded integrations, and the powerful API v4.
MAY 7, 2025 • 7 min read


Build and Scale Your Web Applications Right at the Data Source
Modern businesses demand new ways to build, secure, and scale applications. Azion is at the forefront of this compute technology with its suite of products: Edge Functions, Edge SQL, and Edge Storage.
MAY 6, 2025 • 5 min read
Introducing Azion Edge AI for Smarter and Scalable AI Solutions
Edge AI combines artificial intelligence with edge computing, allowing AI models to run directly on Azion's infrastructure—close to data sources and users—rather than in distant cloud data centers.
MAY 5, 2025 • 5 min read
Using Polyfills to Bridge Gaps in Serverless Edge Environments
Polyfills ensure compatibility across serverless edge environments, enabling developers to use modern web features without sacrificing functionality.
MAR 7, 2025 • 6 min read
Building Modern Serverless Runtimes
Discover how modern serverless runtimes built with Rust and V8 isolates outperform Node.js in performance and security, delivering faster execution times and enhanced memory safety through memory-safe architecture.
FEB 7, 2025 • 8 min read

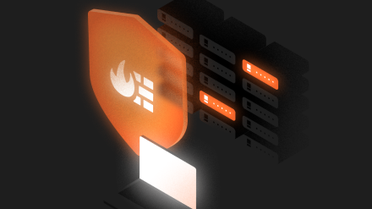
How Technology Can Help You Comply with Regulations for Fintech
Edge computing provides robust security, regulatory compliance, and intelligent monitoring for reliable, scalable operations.
FEB 6, 2025 • 8 min read

Boost Software Quality: Local Development with Azion CLI
Master Edge Functions with Azion CLI for local development and testing. Enhance software security, optimize performance, and streamline debugging.
APR 19, 2024 • 8 min read

Azion Console Kit: Building a new interface
Explore the Azion Console Kit, enhancing user interface for Edge Computing with innovative Azion Blocks and open source toolkits for robust app development.
FEB 21, 2024 • 6 min read

The Experts Speak: Cybersecurity Quotes About Zero-Trust, WAF, Social Engineering, and More
Explore expert insights on cybersecurity, Zero Trust, social engineering, and WAF capabilities at Azion Edge.
FEB 1, 2024 • 7 min read

Leverage the Power of Edge Computing with Azion's New Set of Templates
Discover Azion's Edge Computing templates to enhance web app development, streamline deployment, and optimize performance with tools like MongoDB, Hexo, and Fauna.
JAN 29, 2024 • 5 min read


Azion Celebrates a 2023 Full of Achievements
Discover how Azion's accolades like the Frost & Sullivan Award and Great Place to Work recognition affirm its edge computing superiority in 2023.
DEC 21, 2023 • 6 min read

Subscribe to our Newsletter
Get the latest product updates, event highlights, and tech industry insights delivered to your inbox.