Visibility on what matters
Detect, investigate, and resolve issues in seconds with high-fidelity event data that appears in under a minute—no agents required.


Optimize performance in real time
Spot latency spikes and error trends instantly. Verify fixes with the same dataset.
Investigate security events without delays
Trace attacks instantly down to requests, IPs, user agents, and affected paths.
Correlate across products and workloads
Analyze events from Applications, Functions, WAF, and connected Azion products in one place.
"Azion shielded us from sophisticated cyberattacks and empowered us to modernize our infrastructure, reduce costs, and deliver the best shopping experiences to millions of customers across Latin America."
Allan Monteiro
CISO & Head of Technology
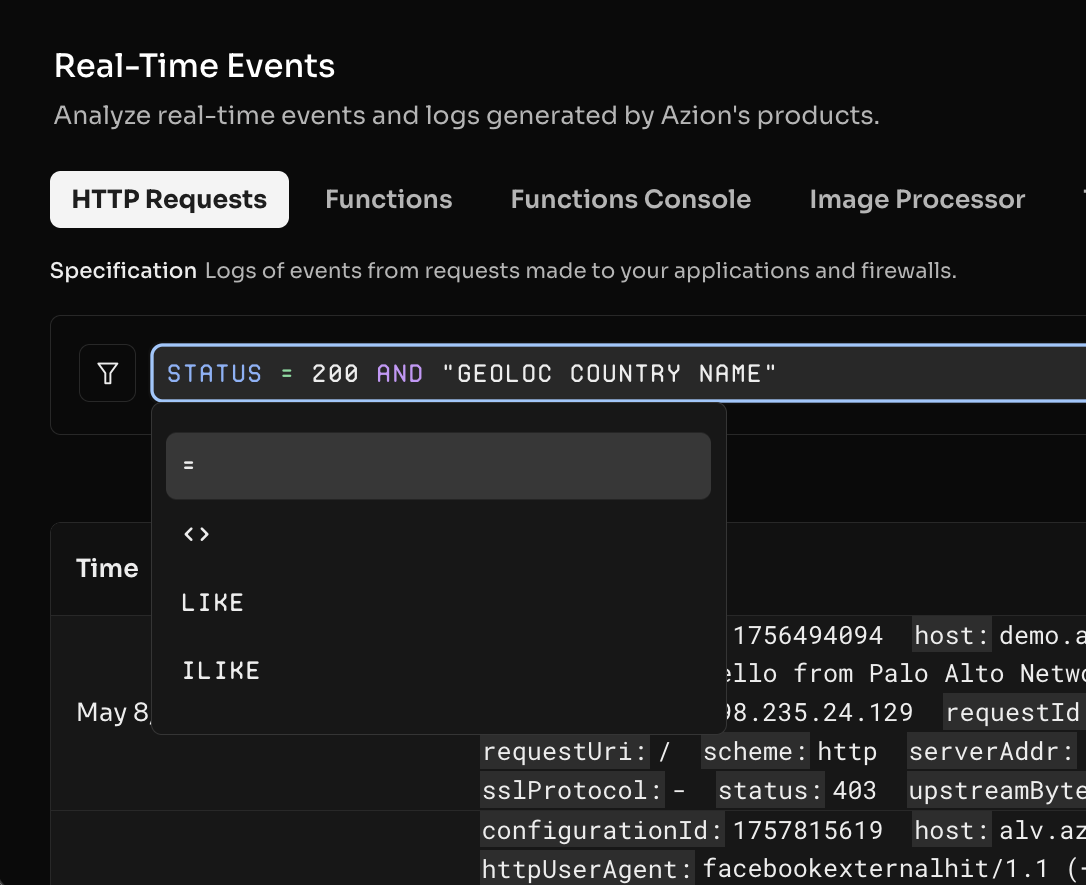
Monitor events in real time
Explore, inspect, and export from Console
View tabular event data, inspect requests in detail, and export results directly from the Azion Console without additional tooling. Docs: https://www.azion.com/en/documentation/products/observe/real-time-events/
Investigate any event across your platform
Access detailed data for every request, response, and security event from Applications, Functions, WAF, and all connected Azion products, drilling down to specific requests, IPs, and timestamps with field-level precision. Docs: https://www.azion.com/en/documentation/products/observe/real-time-events

Connect your logs to Grafana and any analytics tool
Use the GraphQL API to power dashboards, automate incident workflows, and share consistent operational views across your team. Query top IPs, paths, and status codes in real time, group by the dimensions that match your SLOs and KPIs, and export and share consistent views across engineering, security, and ops teams. Docs: https://www.azion.com/en/documentation/devtools/graphql-api/overview/
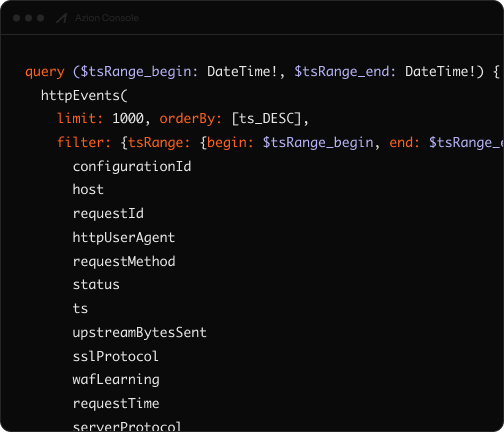
Leverage advanced data transform with GraphQL
Execute complex searches and aggregations using the GraphQL API, with advanced filtering, grouping, and sorting capabilities. Docs: https://www.azion.com/en/documentation/devtools/graphql-api/features/gql-real-time-events-fields
Resolve operational and security issues faster
Real-Time Events FAQ
What is Real-Time Events?
Real-Time Events is an observability capability that lets you explore high-fidelity request, response, and security event data generated by Azion products in near real time.
Which products generate events for Real-Time Events?
You can access events from multiple Azion products, including Applications, Functions, and WAF, depending on what you have configured and enabled in your account.
How do I query data programmatically?
Use Azion’s GraphQL API to run queries with filtering, grouping, and sorting. This makes it easier to build dashboards, automate investigations, and integrate with external tools.
Can I export results for audits or debugging?
Yes. You can export event results from the Console to share with teams, attach to incident reports, and support compliance and auditing workflows.
How quickly can I see event data?
Our globally distributed platform delivers consistently fresh logs in under a minute in most cases. This means 99% of requests or events are available in Real-Time Events in less than 1 minute, no matter where the event was generated.
Do I need to install an agent or collector?
No. Real-Time Events works with data generated by Azion products. You don’t need to deploy extra agents to start exploring the events you already produce.
Can I use Real-Time Events during incidents?
Yes. Teams use Real-Time Events to detect anomalies, investigate suspicious traffic patterns, validate mitigations, and shorten time to resolution with detailed event context.
Where can I find query examples?
Start with the GraphQL API documentation and the Real-Time Events docs for guidance on fields, filters, and workflows.
See everything.Act faster.
Get clearer visibility, faster response, and fewer blind spots across your stack.