Observability is a fundamental and extremely powerful practice for dealing with distributed and increasingly dynamic and complex systems. This is because observability is able to provide a holistic view of a system and allow you to determine when, why and how an atypical event happened, in addition to enabling the prevention of incidents.
Observability: An Old Acquaintance
Observability is a word that has recently gained traction in content and conversations about technology. It may seem new to our vocabulary, but contrary to what many people think, observability has been part of the engineering world for a long time. With the advent of computers and IT, systems have become part of this world of technology as well, and with the popularization of cloud-based services and applications, observability is an essential practice when it comes to systems integrity control strategies in software development.
Better Safe Than Sorry
And why is the use of observability so important? It’s simple: because each and every system is doomed to fail. So when it comes to distributed systems and their challenges, it’s worth adopting that old adage “better safe than sorry”. That’s where observability comes in, because with it developers can, in the fastest way, minimize and even avoid the impacts that will eventually arise.
What is Observability?
Let’s start with some history of the concept of observability. It appeared in the literature in the 1960s and was introduced by Rudolf E. Kálmán as part of the control of linear dynamical systems practices, described by him in his Theory of Control Systems¹. The central idea of this theory was based on the development of a model to control dynamic systems in industrial processes and guarantee their stability.
Although the execution of observability was initially intended for the engineering of machines in industry, with the evolution of the technology of these equipments and the creation of others, applying this practice has been extended to countless other processes and areas that work with feedback systems – in the case of IT, more specifically in the context of creating software and applications with distributed microservice architectures.
The observability practice gained, then, a prominent role, especially when it comes to the DevOps context. In the words of Cindy Sridharan, in her work Distributed Systems Observability, “As systems become more distributed, the methods for building and operating them are rapidly evolving – and this makes the visibility of your services and infrastructure more important than ever.”
From a theoretical perspective, the concept of observability is defined by Kálmán as “a measure of how well the internal states of a system can be inferred from knowledge of its external outputs.”². To simplify, when we bring this concept to the IT context, we can say that observability allows practically a 360ᵒ view of the events and performance that occur in a system or in an environment in which it’s being performed. In addition, more than identifying problems in real time, observability delivers data that allows the complete observance of the application flow, which also allows the prevention of failures in the future. The general objective of observability is, therefore, to understand the behavior and states of applications through the observation of their outputs, the application data.
In addition, we can also say that observability is one of the aspects that make up the control of systems and, today, it’s the basis of the set of SRE (Site Reliability Engineering) practices, whose purpose is to add reliability to a distributed system.
The Pillars of Observability
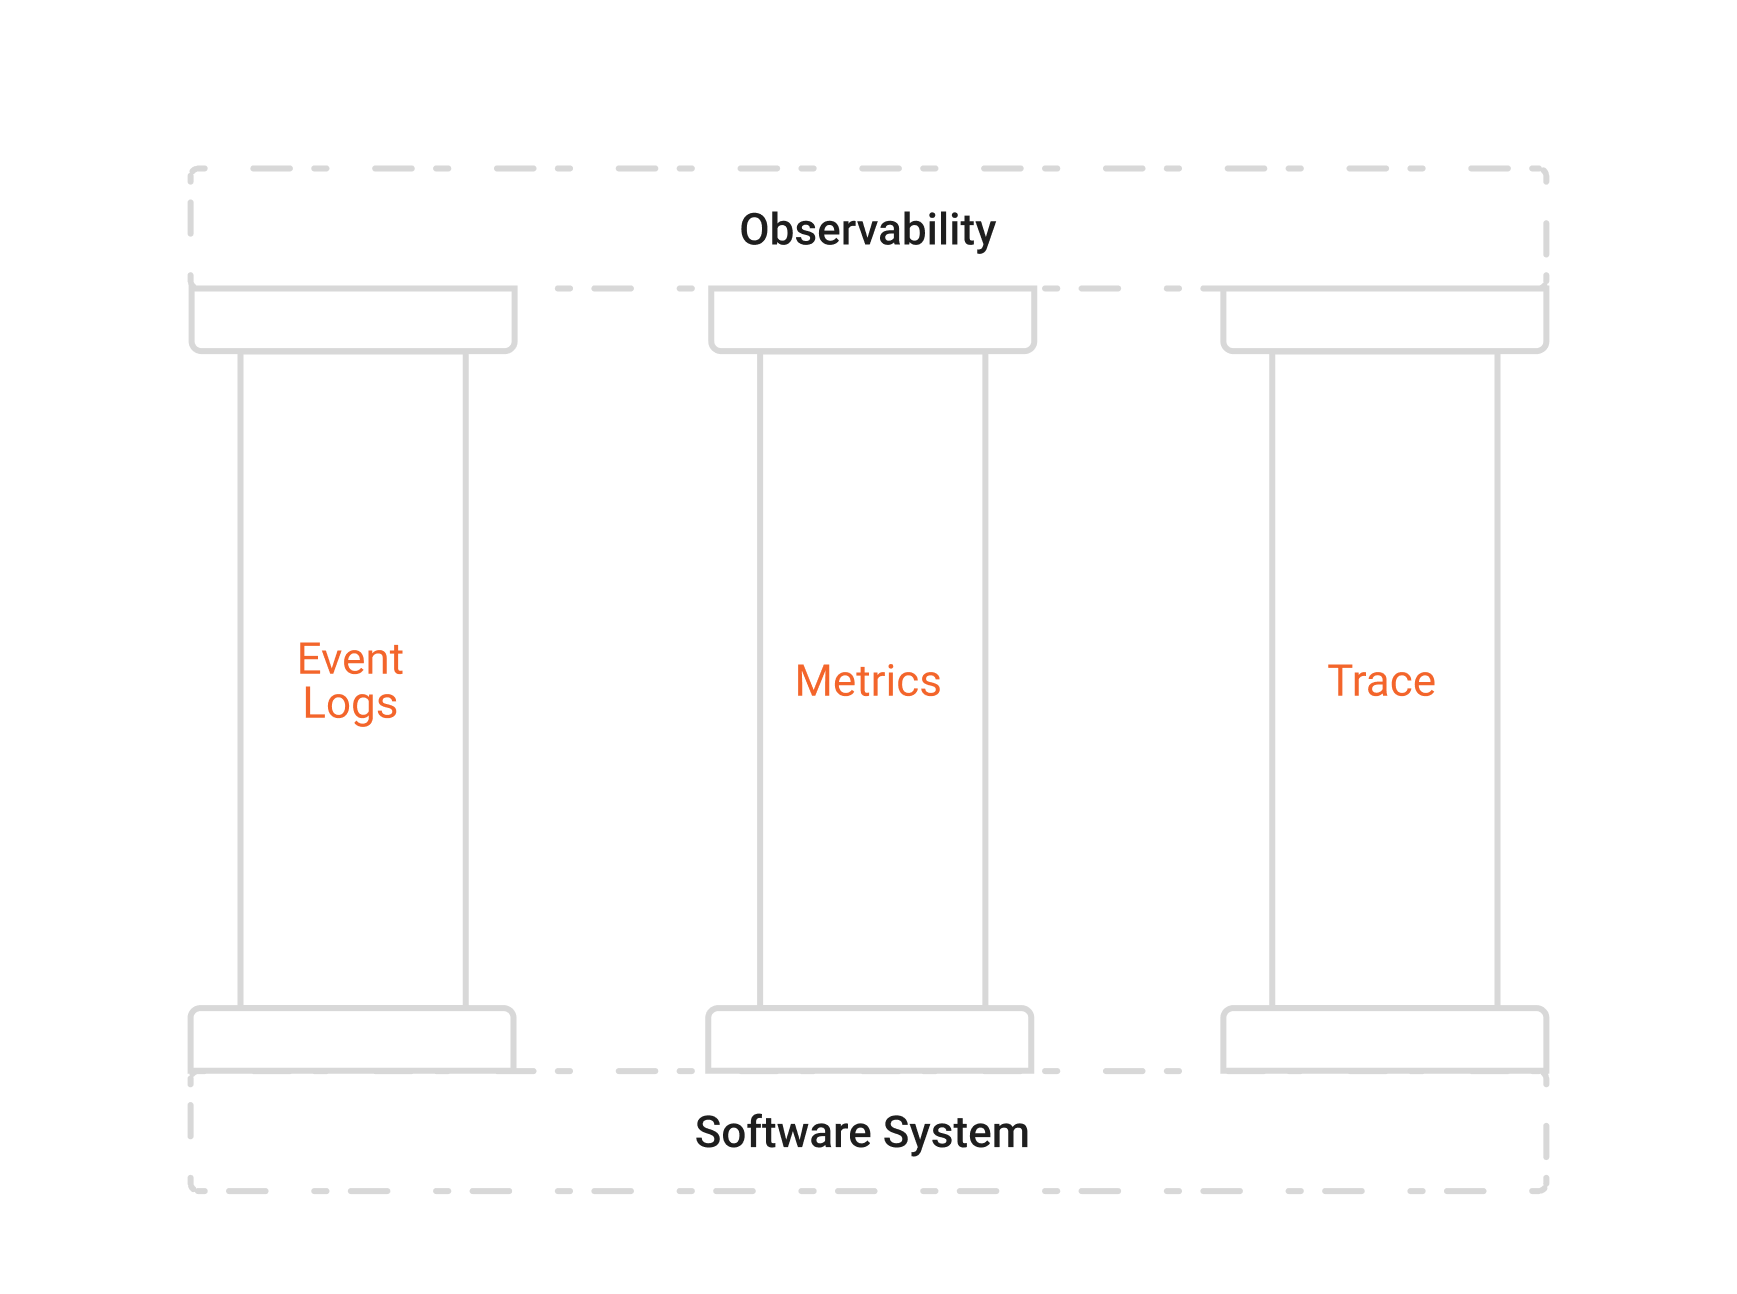
The observability process is based on the use of telemetry data, also called observability pillars, to gather information about the system. These pillars are essential and must be worked in an integrated way to obtain a successful approach, which will provide not only understanding about which incidents and when they occur, but also about their origin, their triggers.

- Event logs - a precious resource as it acts like a system diary, which records specific events in text format and provides a timestamp with details about the event that has occurred. This functionality is usually the first to be checked when an incident happens and can be obtained in three formats: plain text, binary and structured.
- Metrics - are numerical representations of data, quantitative values about the system performance, which are used to analyze the behavior of an event or a component over time intervals. Metrics are then a grouping of log records and allow longer data retention. In addition, they provide information such as name, date, time and KPIs.
- Trace - tracks and displays the entire end-to-end path of a request across the entire distributed architecture, as well as showing how services connect, including providing code-level details.
Benefits of Observability
There are numerous benefits that the practice of observability adds to distributed systems and companies that adopt it, but, to summarize, the main ones are:

- Better Visibility and Safer Monitoring
Discover and attack “known unknowns” and “unknown unknowns” – that is, you will get to know about expected events and those you don’t know that exist. Track potential threats and stream data to your SIEM in real time, while creating automated incident responses with our APIs. Prevent issues from occurring by identifying them early, and if something occurs, you have the data to quickly find the root cause.
- Better Business Insight
Get smart business insights and forecasts, and know who the customer is and what they are doing.
- Faster Workflow and DevOps
With all of these tools, the workflow is optimized, as well as the work of the DevOps team.
- Better User Experience
Get the best analysis of your customer and their interaction to better optimize their experience.
Azion’s Observability Solution
Do you want to have full control over your system, but don’t know where to start or don’t have time to waste learning and testing various tools? Don’t worry, Azion has the best solution: Edge Analytics, our complete observability package, made up of the powerful tools Data Stream, Edge Pulse, Real-Time Events, and Real-Time Metrics.
Edge Analytics: 360-Degree Vision and Maximum Integrity
Below are the features that make up our Edge Analytics observability package and what they offer:
Data Stream
- Build better and more profitable products for your business, with relevant and real-time data.
- Use End-to-end encryption to meet auditing and compliance requirements.
- Empower DevOps and business teams with real-time insight into your applications on the Azion Platform.
- Use real-time delivery mechanisms with pre-built connectors allow HTTP/HTTPS Post and tools such as Kafka, S3 (Simple Storage Service), and others.
Edge Pulse
- Get real user monitoring (RUM) data from the accessing of your applications.
- Monitor how resource demands impact the user experience.
- Probe network performance and availability and help to improve the delivery of content to your users.
Real-Time Events
- Troubleshoot your applications using a friendly, intuitive interface.
- Consult data from different sources and monitor your application’s behavior.
- Save complex queries and explore your application data.
- View your application’s events in real time and track its history for up to three days.
Real-Time Metrics
- Get real-time insight into what is happening with your content and applications.
- Dozens of metrics to help you optimize your applications and infrastructure.
- Integrate our metrics with your favorite tools and respond to events in real time.
- Arrive at critical decisions faster, based on real-time data.
- Provides your DevOps team with the transparency they need for troubleshooting.
So if you want to have a complete view of your system and ensure its complete integrity, contact our sales team here.
Reference
¹ ⁻ ² Kalman R. E., “On the General Theory of Control Systems”, Proceedings of the First International Congress on Automatic Control, Butterworth, London, 1960.


